My first Kaggle competition in 10 years
TL;DR
I built a deep CNN model to predict tackle probability, which I used to evaluate tackle efficiency. Although I did not win the competition, I had a fun building the model and am satisfied with the results.
quick links
Kaggle submission
source code
Motivation
For the first time since I had been old enough to work, I have been without a job for more than a few weeks after being an unfortunate casualty of the Meta layoffs of ‘22-‘23. I decided to enjoy the rest of the year: travel, explore, and unwind. Once the wet season began here in Portland, I started to get antsy and for the first time in about ten years I entered a Kaggle competition. I couldn’t even find my previous login details, so I started fresh.
For years I have tinkered with the idea of building an NFL simulation model. A few years ago I built a rules-based program to parse the play-by-play descriptions into individual events to populate a database. nflfastR replaced that process plus a whole lot more. Along with scraped Madden ratings, I managed to build some pretty decent models to project career trajectory, but not much beyond that. The problem (other than finding the spare time) is publicly available NFL data is really limited. We don’t know what most of the 22 players did on the play - we can rely only on the play’s events (tackle, run, catch etc.).
So when I went on to Kaggle and saw the NFL was hosting its annual “Big Data” competition, I got excited. The competition was already beyond the half-way mark and I was in the minority by entering solo, but I became determined to participate.
This years competition is based around tackling. The NFL provided tracking data for every player on eligible plays over a 9-week span for data scientists to use (eligible plays are all non-special teams plays excluding incompletions). I decided to build a model to estimate tackle probability as the play progressed and use the model to evaluate player tackle efficiency. I assumed (and was correct) that this would be the most popular type of submission, however I wanted to keep the objective simple and reachable and was not concerned with winning.
With the 5 weeks until submission, I decided to attempt to keep to a strict schedule:
| Week | Objective |
|---|---|
| 1 | EDA & feature engineer |
| 2 | Model prototype |
| 3 | Model architecture |
| 4 | Hypertuning and applying the model |
| 5 | Write up the report |
Modeling Overview
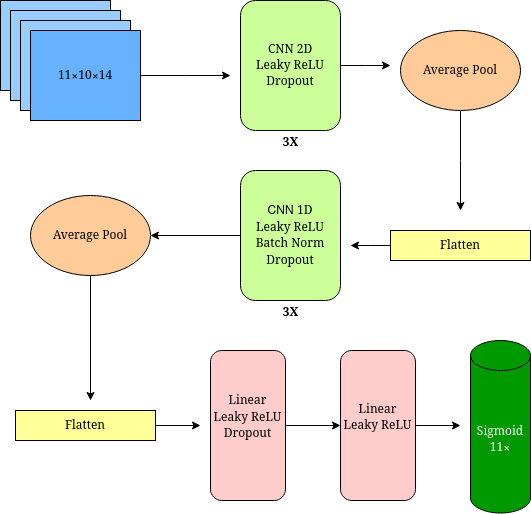
I leveraged the winning submission from a few years ago and built a deep CNN, using a similar architecture as the authors described. A high-level model diagram is below:

The model was built in PyTorch and I customized tensorboard to monitor the training results. My desktop has a RTX 2070i, which was sufficiently fast enough for this size model. The model needed to meet the following objectives:
-
Obey the law of probability. For each play a touchdown is score or 1 tackle is credited or 2 tackles are credited. Hence the total probability across all 11 defenders must sum <= 200% and be >= 100% - probability of a touchdown. For the most part, the model output obeyed the objective but I did rescale the estimates in cases where the law of probability was violated.
-
The model is expected to perform better later in the play vs. earlier. I decided to augment the training data on the final 10 seconds of the play by flipping the play to opposite direction
-
Relative location of all 22 players matter. I go into more detail below describing how this is handled.
-
Final output should be simple. The model must be able to translate into simple metrics to evaluate defenders’ tackling ability
-
Have a proxy to evaluate the model against. I used missed tackle rate as a proxy
The model is trained frame-by-frame (10 frames per second) using 11X10X14 tensors as the input layer. The 11X10 represent the 11 defenders and 10 offensive players, excluding the ball carrier. The 14 “channels” (features) include:
- Location of ball carrier (x and y axes)
- Relative location of defender vs. offensive player (x and y axes)
- Relative location of defender vs. ball carrier (x and y axes)
- Relative speed of defender vs. offensive player (x and y axes). The direction and absolute speed are provided in the tracking data, which I converted to 2D velocity
- Relative speed of defender vs. ball carrier (x and y axes).
- Relative weight of defender vs. offensive player
- Relative weight of defender vs. ball carrier
- Relative speed potential of defender vs. offensive player. The speed potential was simply the max speed for a given player across the entire dataset (actually second fastest to control for some outliers)
- Relative speed potential of defender vs. ball carrier
After testing out a variety of architectures, activation functions, optimization routines (Adam performed best), I was happy to have a model that produced good, stable results on the test set (I randomly omitted plays from 30% of games for testing).
Outcomes and Learnings
The area I was least happy with is the results could be a little spiky, which is a common issue with CNN’s (pixel adversarial attacks, for example). If I had more time, I would have liked to attempt to transform the model to be autoregressive, possibly using the sequence of previous predictions within the play’s frames as an input layer. One way this can be accomplished is by concatenating a fixed length vector to the 14-dimensional layer described above. The vector would need to be at least as long as the longest play (roughly 100 frames), zero-padding each entry beyond the current frame.
However, I was running out of time and applied a smoothing layer after the model results, using exponential smoothing for a given defender across each frame of the play. While not ideal, this was easy to apply and did a better job then other smoothing techniques I tested.
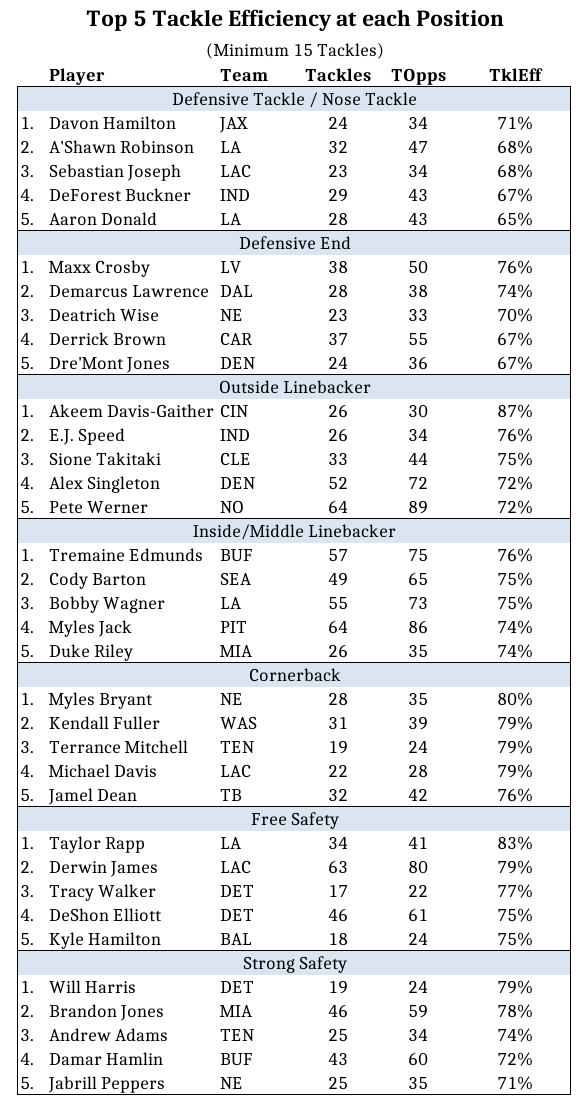
To create a metric from the model, I used the following definition to identify tackle opportunities:
- Tackle Opportunity (TOpp)
- A defender is credited with a TOpp if 2 conditions hold simultaneously: (1) they are the most likely player to tackle the ball carrier (2) with a probability of at least 50% at any point during the play. A player can only be credited with 0 or 1 TOpp in a play.
A players tackle efficiency = \(\frac{\text{Total Tackles}}{\text{Tackle Opportunities}}\)
Below are the results. If you made it this far, thanks for reading!
